-
Back to menu
Prices
-
Back to menu
-
Back to menu
Indices -
Back to menu
Research
-
Back to menu
Events -
Back to menu
Sponsored
-
Back to menu
Videos -
Back to menu
-
Back to menu
-
Back to menu
Webinars
Select Language
By CD Analytics, Oliver Knight
Updated Aug 19, 2025, 3:57 p.m. Published Aug 19, 2025, 3:57 p.m.

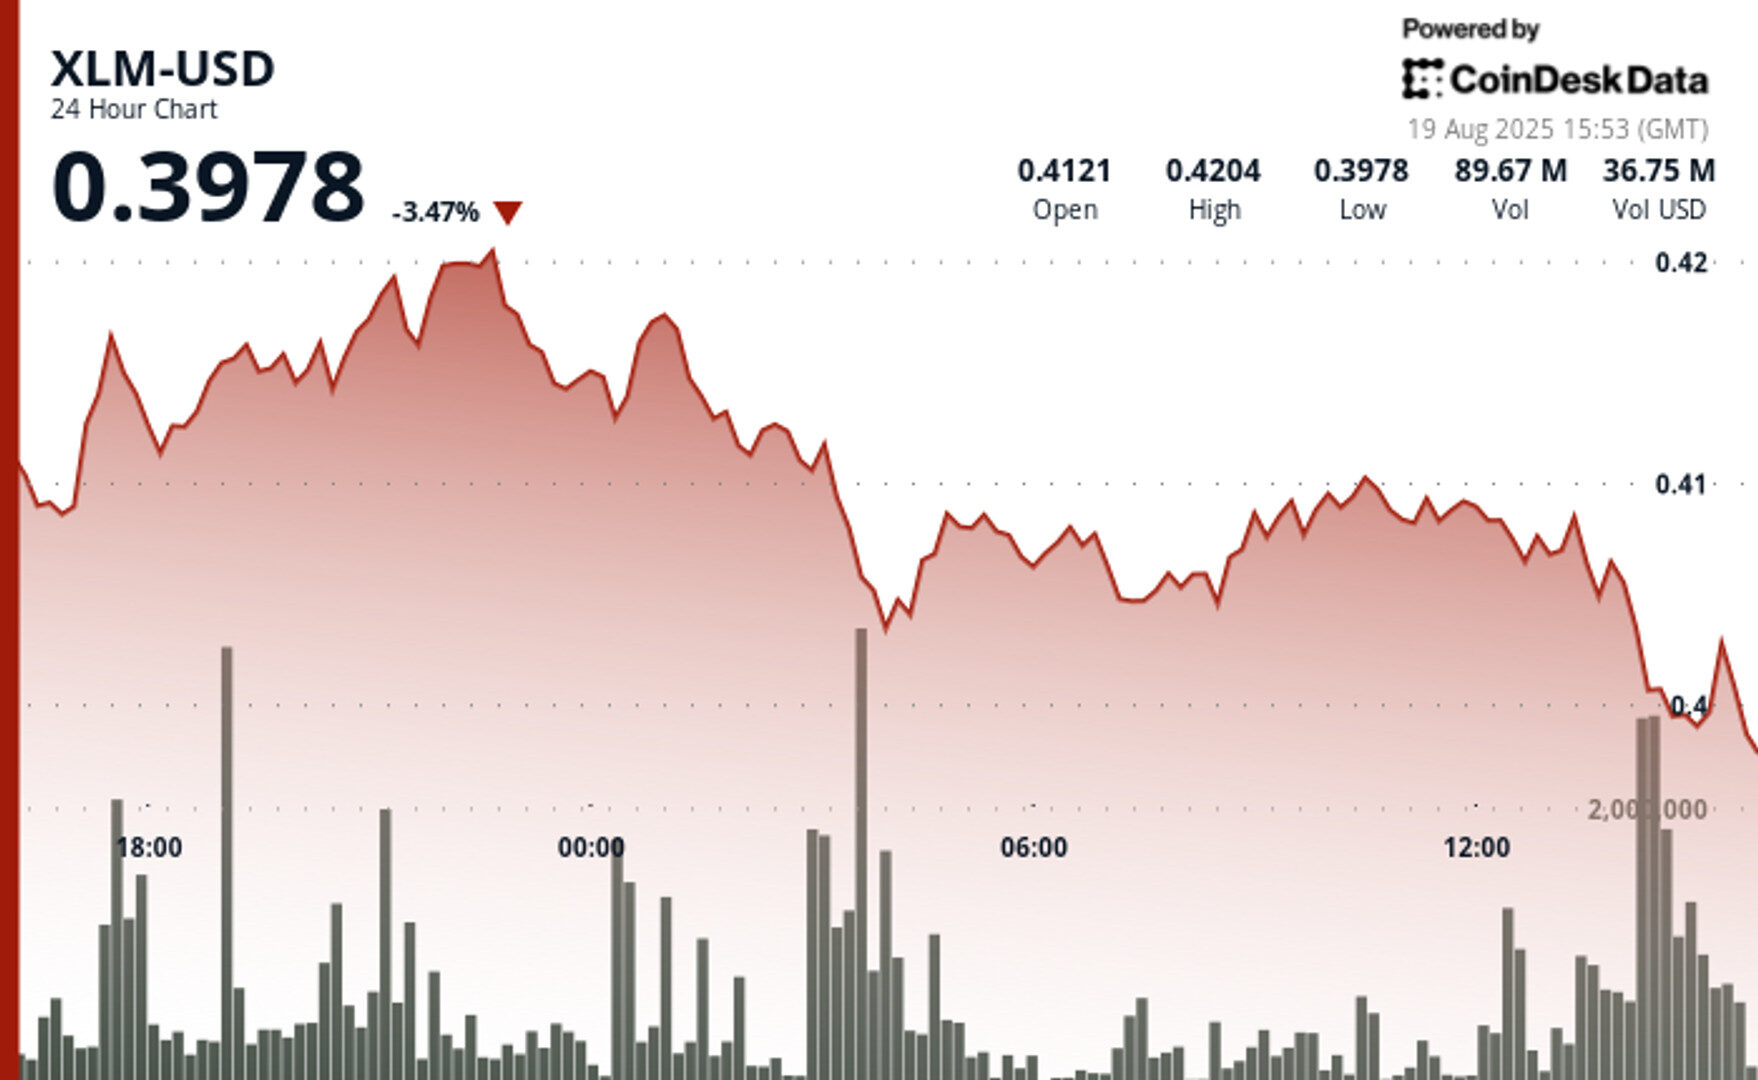
- XLM drops 1.75% over 24 hours, sliding from $0.41 to $0.40 as volatility spikes to 4.32%.
- Heavy sell pressure sets new resistance at $0.410 while critical support at $0.403–$0.405 shows signs of weakening.
- Broader market drag: Bitcoin steadies near $115K but altcoin losses weigh on Stellar despite growing institutional adoption.
Stellar’s XLM token slipped 1.75% over the past 24 hours, falling from $0.41 to $0.40 as volatility picked up across the market. The trading range widened to 4.32% during the period, with a sharp selloff at 03:00 UTC on Aug. 19 driving volumes to 52.17 million — more than double the daily average. The move cemented resistance at $0.41 while leaving a narrow support band in the $0.403–$0.405 range.
The pressure intensified into the session’s close, with XLM sliding from $0.407 to $0.403 between 13:25 and 14:24 UTC. Selling was heaviest in the 13:30–13:46 window, when the token dropped from $0.410 to $0.404 on unusually high per-minute volumes. That action reinforced new resistance at $0.410 while further weakening support at $0.403–$0.405.
STORY CONTINUES BELOW
The latest downturn comes as broader crypto markets consolidated, with bitcoin hovering near $115,000 and most altcoins in the red. While institutional interest in Stellar continues to grow — underlined by the foundation’s investment in digital securities exchange Archax — market headwinds have overshadowed those developments.
XLM’s failure to hold above $0.41 leaves it vulnerable to deeper losses if the $0.403 level gives way. A breakdown below that zone would open the door to further declines, particularly as volumes tapered off late in the session, hinting at fading buyer support. For now, traders will be watching whether the token can defend its critical support or risk a move lower in line with broader altcoin weakness.

- Volume surges to 52.17 million during major decline, exceeding 24-hour average of 25.43 million by 105%.
- Resistance solidifies at $0.41 following multiple rejection attempts.
- Support zone materializes between $0.403-$0.405 amid repeated buying waves.
- Secondary resistance confirmed at $0.418-$0.420 after multiple price failures.
- Recent volume drops below average, indicating potential bearish continuation.
- $0.403 support level requires immediate monitoring for breakdown or reversal patterns.
Disclaimer: Parts of this article were generated with the assistance from AI tools and reviewed by our editorial team to ensure accuracy and adherence to our standards. For more information, see CoinDesk’s full AI Policy.
CoinDesk Analytics is CoinDesk’s AI-powered tool that, with the help of human reporters, generates market data analysis, price movement reports, and financial content focused on cryptocurrency and blockchain markets.
All content produced by CoinDesk Analytics is undergoes human editing by CoinDesk’s editorial team before publication. The tool synthesizes market data and information from CoinDesk Data and other sources to create timely market reports, with all external sources clearly attributed within each article.
CoinDesk Analytics operates under CoinDesk’s AI content guidelines, which prioritize accuracy, transparency, and editorial oversight. Learn more about CoinDesk’s approach to AI-generated content in our AI policy.

Oliver Knight is the co-leader of CoinDesk data tokens and data team. Before joining CoinDesk in 2022 Oliver spent three years as the chief reporter at Coin Rivet. He first started investing in bitcoin in 2013 and spent a period of his career working at a market making firm in the UK. He does not currently have any crypto holdings.

More For You
By CD Analytics, Oliver Knight
15 minutes ago

The token broke through key support levels in volatile trading after hotter-than-expected U.S. inflation data spurred $460 million in crypto liquidations.
What to know:
- HBAR slumped 2.46% to $0.238 between August 18–19, breaking key support levels amid heavy selling and elevated trading volumes.
- Macro headwinds intensified pressure, with U.S. Producer Price Index data exceeding Fed forecasts and triggering $460M in crypto liquidations.
- Long-term outlook remains supported by HBAR’s enterprise-grade infrastructure and partnerships, despite short-term volatility.


