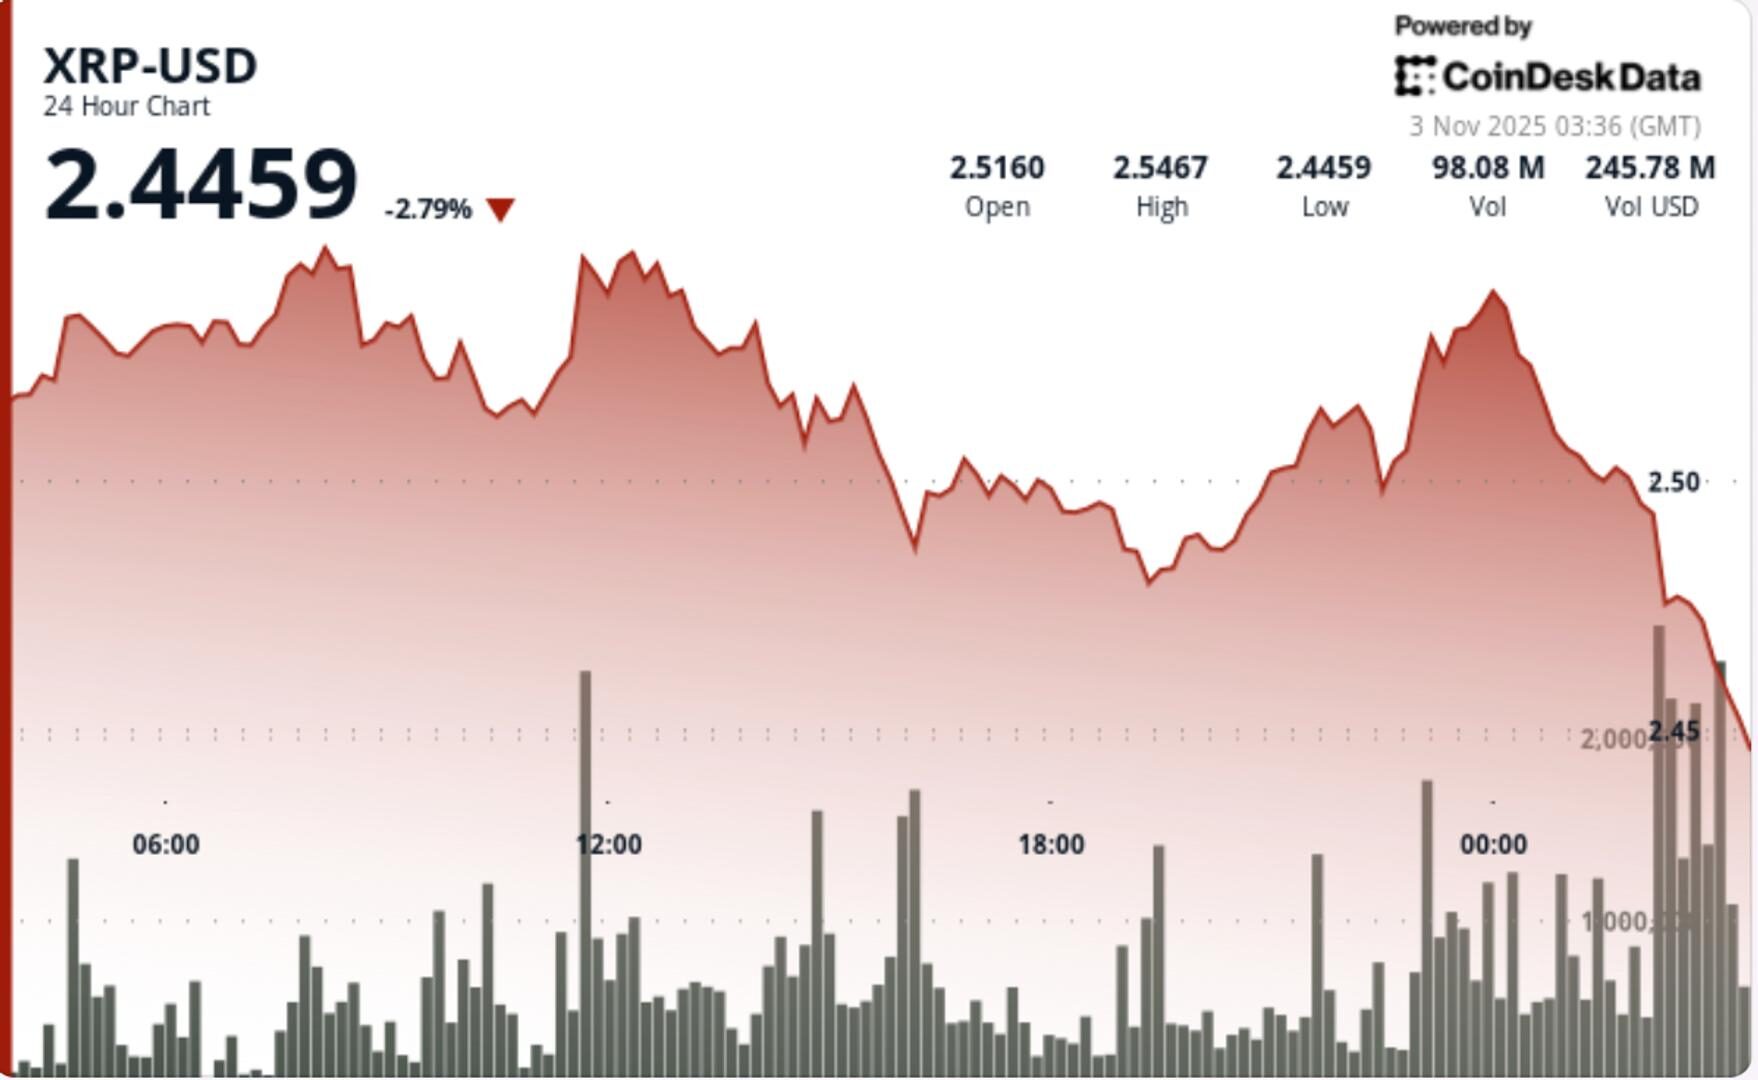
Traders are closely monitoring the $2.49 support level, as sustained closes below could lead to further declines.
By Shaurya Malwa, CD Analytics
Updated Nov 3, 2025, 4:01 a.m. Published Nov 3, 2025, 4:00 a.m.

- XRP fell 1.2% to $2.49, facing strong resistance at $2.55 amid heavy institutional activity.
- The digital asset’s trading was dominated by technical flows, with volume surging 85% above the recent average.
- Traders are closely monitoring the $2.49 support level, as sustained closes below could lead to further declines.
XRP slipped below the $2.50 mark during Tuesday’s session, falling 1.2% to $2.49 as repeated rejections at $2.55 confirmed strong resistance. The decline came on heavy institutional activity, with volume surging 85% above the recent average as sellers consolidated control at the upper end of XRP’s trading range.
- The digital asset traded between $2.49–$2.55 over the 24-hour session, with price action dominated by technical flows rather than fundamental drivers.
- Three failed breakout attempts at $2.54–$2.55 defined the session’s tone, each accompanied by elevated sell-side volume.
- Overall activity climbed 85% above the 7-day average, as total turnover reached 50.3 million tokens during the decline — confirming institutional-scale distribution at resistance levels.
- Market sentiment remains mixed after recent gains, with traders watching whether XRP can maintain support above $2.49 amid broader consolidation in high-beta crypto assets.
- XRP’s 24-hour session saw price fluctuate within a $0.07 range, stabilizing near $2.497 after dipping to intraday lows of $2.49. The 60-minute chart revealed brief attempts to reclaim $2.50.
- This behavior suggests institutional reaccumulation around the $2.50 mark — a level historically associated with short-term liquidity traps. Despite the pullback, buyers have defended the psychological floor through multiple retests.
- However, market microstructure analysis shows a shift in momentum as sell orders cluster above $2.54, limiting near-term upside until volume profiles realign with prior bullish patterns.
- The session’s repeated rejections at $2.55 confirmed a developing lower-high formation on daily charts, indicating fading momentum following October’s rally.
- The $2.50 support continues to act as a key psychological and structural pivot; maintaining closes above this threshold remains essential for preserving the medium-term bullish bias.
- Momentum indicators, including RSI and MACD, hover near neutral territory, suggesting a potential pause phase rather than outright reversal.
- Volume concentration at upper resistance levels — particularly the 50.3M spike during the selloff — confirms active profit-taking from larger holders.
- Declining volume in the subsequent consolidation implies early signs of accumulation, with institutional buyers potentially layering bids near the $2.49–$2.50 zone.
- XRP’s near-term trajectory hinges on whether the $2.49 support can withstand further tests.
- Sustained closes below this level could open downside toward $2.46, while a clean breakout above $2.55 would reset short-term sentiment and target the $2.60 extension.
- Traders are watching for confirmation through volume alignment: expansion on upward moves would validate renewed demand, while continued fading activity would reinforce a range-bound outlook.
- Until directional confirmation emerges, positioning remains tactical — with liquidity pockets at $2.49–$2.50 offering short-term opportunities for both mean-reversion and breakout traders.
More For You
Oct 16, 2025

Stablecoin payment volumes have grown to $19.4B year-to-date in 2025. OwlTing aims to capture this market by developing payment infrastructure that processes transactions in seconds for fractions of a cent.
More For You
By Sam Reynolds|Edited by Aoyon Ashraf
2 hours ago

BTC holds near $110K and Ethereum trades around $3,900 as liquidations ease and market makers report clients slowly re-entering risk after the Fed-driven selloff.
What to know:
- Bitcoin and Ether begin the week trading above $110,000 and $3,880 respectively, despite a significant decline over the past 30 days.
- FlowDesk notes traders are cautiously buying BTC, HYPE, and SYRUP tokens, while Solana-linked assets lag.
- Crypto derivatives saw $155 million liquidated, indicating a moderate flush of overleveraged longs rather than panic selling.


