The breach of the $2.50 level triggered significant trading activity, with a 158% increase in volume.
By Shaurya Malwa, CD Analytics
Updated Oct 31, 2025, 5:12 a.m. Published Oct 31, 2025, 5:12 a.m.
- XRP fell 5% to $2.47, breaking below the $2.50 support due to increased institutional selling.
- The breach of the $2.50 level triggered significant trading activity, with a 158% increase in volume.
- Traders are watching if the $2.43–$2.46 range can stabilize or if a drop below $2.40 will lead to further declines.
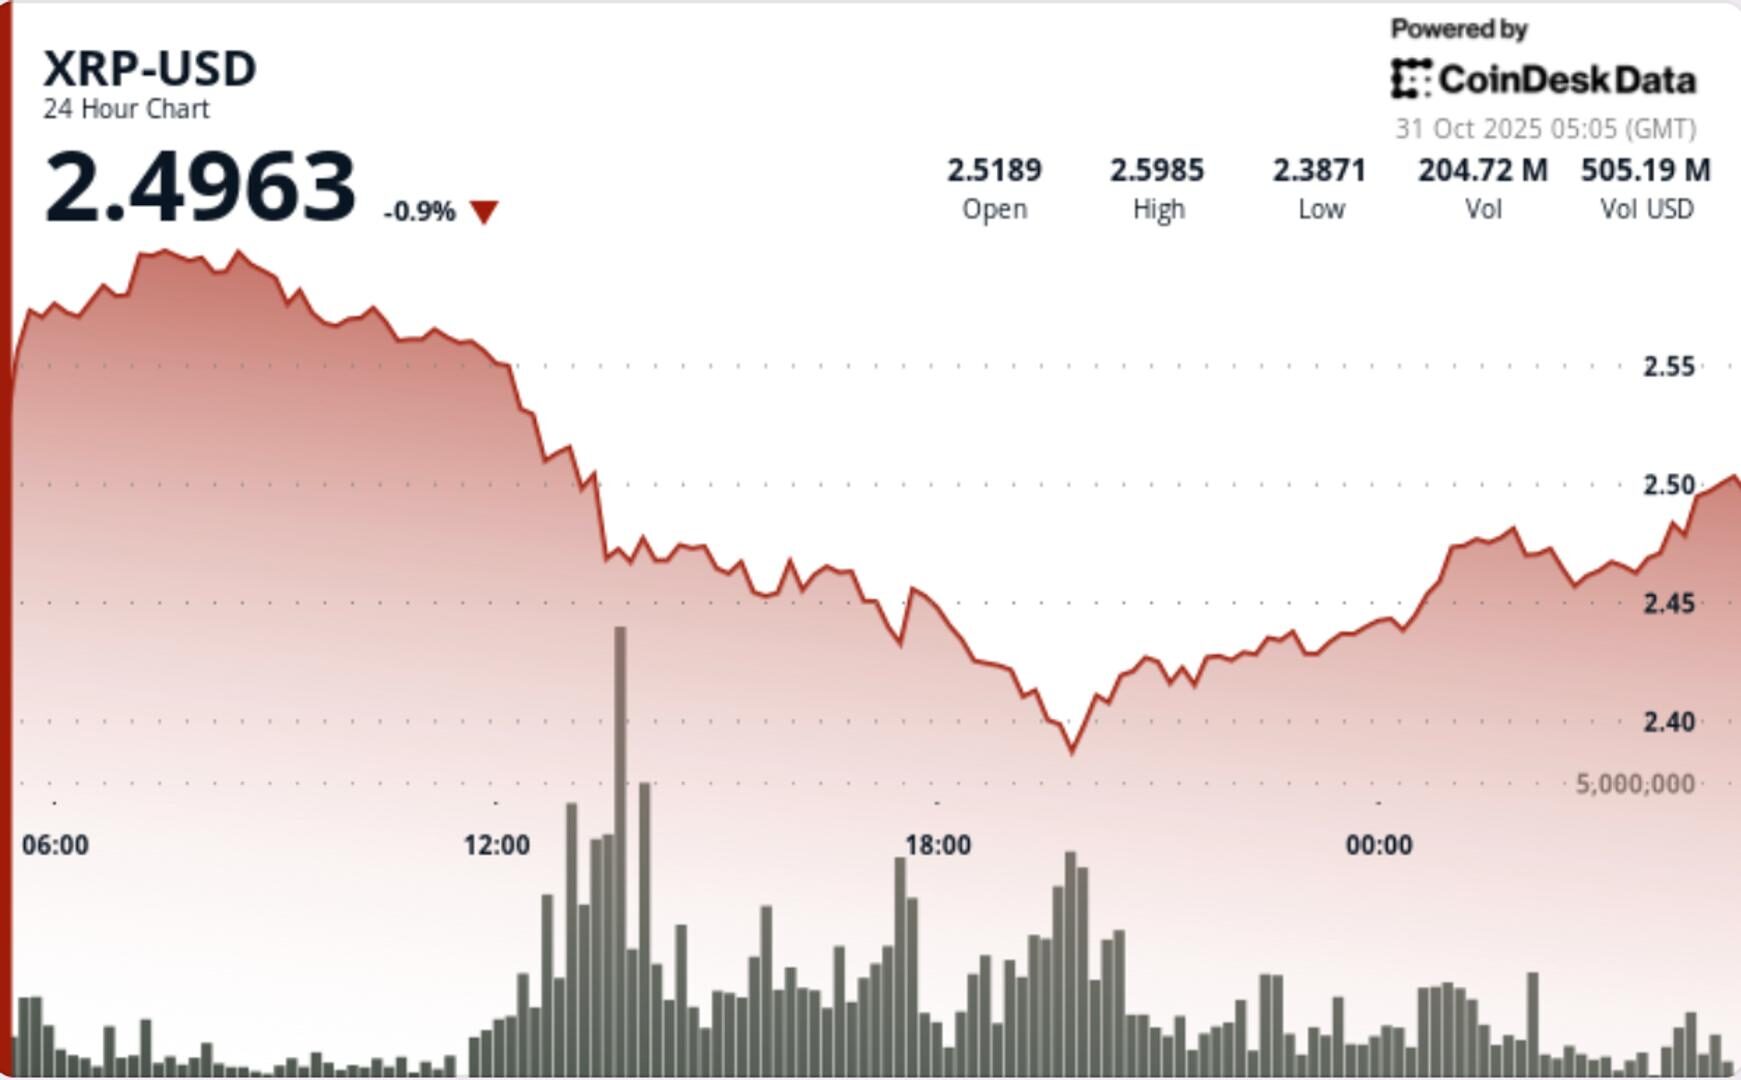
XRP broke below the $2.50 support during Tuesday’s session, sliding 5% to $2.47 as institutional selling pressure accelerated across major exchanges. The breakdown confirmed a decisive shift in structure following weeks of tight consolidation, with volume and chart patterns now aligning toward a deeper corrective phase.
- The token’s 24-hour session saw prices tumble from $2.60 to $2.47, marking one of the largest single-day declines this month.
- The breach of the $2.50 psychological level triggered a wave of algorithmic and institutional selling, propelling trading activity to 169 million tokens, up 158% versus the 24-hour average.
- XRP’s market underperformance contrasts with broader crypto strength, suggesting rotation away from altcoins as risk appetite cools amid waning speculative participation.
- The breakdown reinforced strong overhead resistance at $2.60, where repeated rejection points over recent weeks had capped upside momentum.
- The selloff unfolded in structured phases through Tuesday’s trading. The initial breakdown began at 13:00 UTC, when heavy sell volume drove price decisively through the $2.50 support, igniting a cascade that extended to intraday lows near $2.38.
- Subsequent price stabilization formed around the $2.43–$2.46 range, suggesting the early stages of a potential consolidation base.
- Short-term momentum readings indicated exhaustion as volume tapered into the close, a dynamic often preceding interim pauses in trending declines.
- On the microstructure level, 60-minute data showed two distinct distribution waves as XRP slipped from $2.472 to $2.466.
- Successive hourly volume spikes of 2.8M and 2.6M tokens—each exceeding 300% of hourly averages—confirmed continued institutional control over intraday flows.
- XRP’s breakdown marks a continuation of its lower-high, lower-low structure that began after the failed retest of the $2.60 resistance.
- The session’s 8.8% volatility range underscores aggressive liquidation and profit-taking from larger holders, aligning with recent on-chain signals of exchange inflows.
- Momentum indicators such as RSI have shifted into neutral-to-bearish territory, while MACD shows expanding downside divergence. The $2.40–$2.42 area now acts as immediate technical support, and a close below this band could open further downside toward $2.30–$2.33.
- Volume analytics remain pivotal— the 169M turnover during breakdown confirms institutional participation rather than retail panic, while declining late-session activity implies that the bulk of distribution may already be complete.
- Traders are closely monitoring whether $2.43–$2.46 can evolve into a stable accumulation zone or if a clean break below $2.40 accelerates capitulation.
- Reclaiming the $2.50 level would be required to neutralize short-term bearish momentum and reestablish a constructive setup targeting $2.60.
- Until then, rallies toward resistance are likely to face supply from trapped longs and short-term profit-takers.
- Broader sentiment remains cautious amid risk-off rotation, with derivatives positioning showing declining open interest and modest upticks in short exposure across perpetual futures markets.
More For You
Oct 16, 2025

Stablecoin payment volumes have grown to $19.4B year-to-date in 2025. OwlTing aims to capture this market by developing payment infrastructure that processes transactions in seconds for fractions of a cent.
More For You
2 hours ago

The relative weakness in ETH is evident from host of factors, including DATs and options.
What to know:
- A research firm suggests hedging bullish bitcoin positions by shorting ether due to weak demand and limited capital for major ETH buyers.
- Market flows suggests preference for bitcoin over ether, with increased demand for put options on ether.


