-
Back to menu
Prices
-
Back to menu
-
Back to menu
Indices -
Back to menu
Research
-
Back to menu
Events -
Back to menu
Sponsored
-
Back to menu
Videos -
Back to menu
-
Back to menu
-
Back to menu
Webinars
Select Language
Share this article
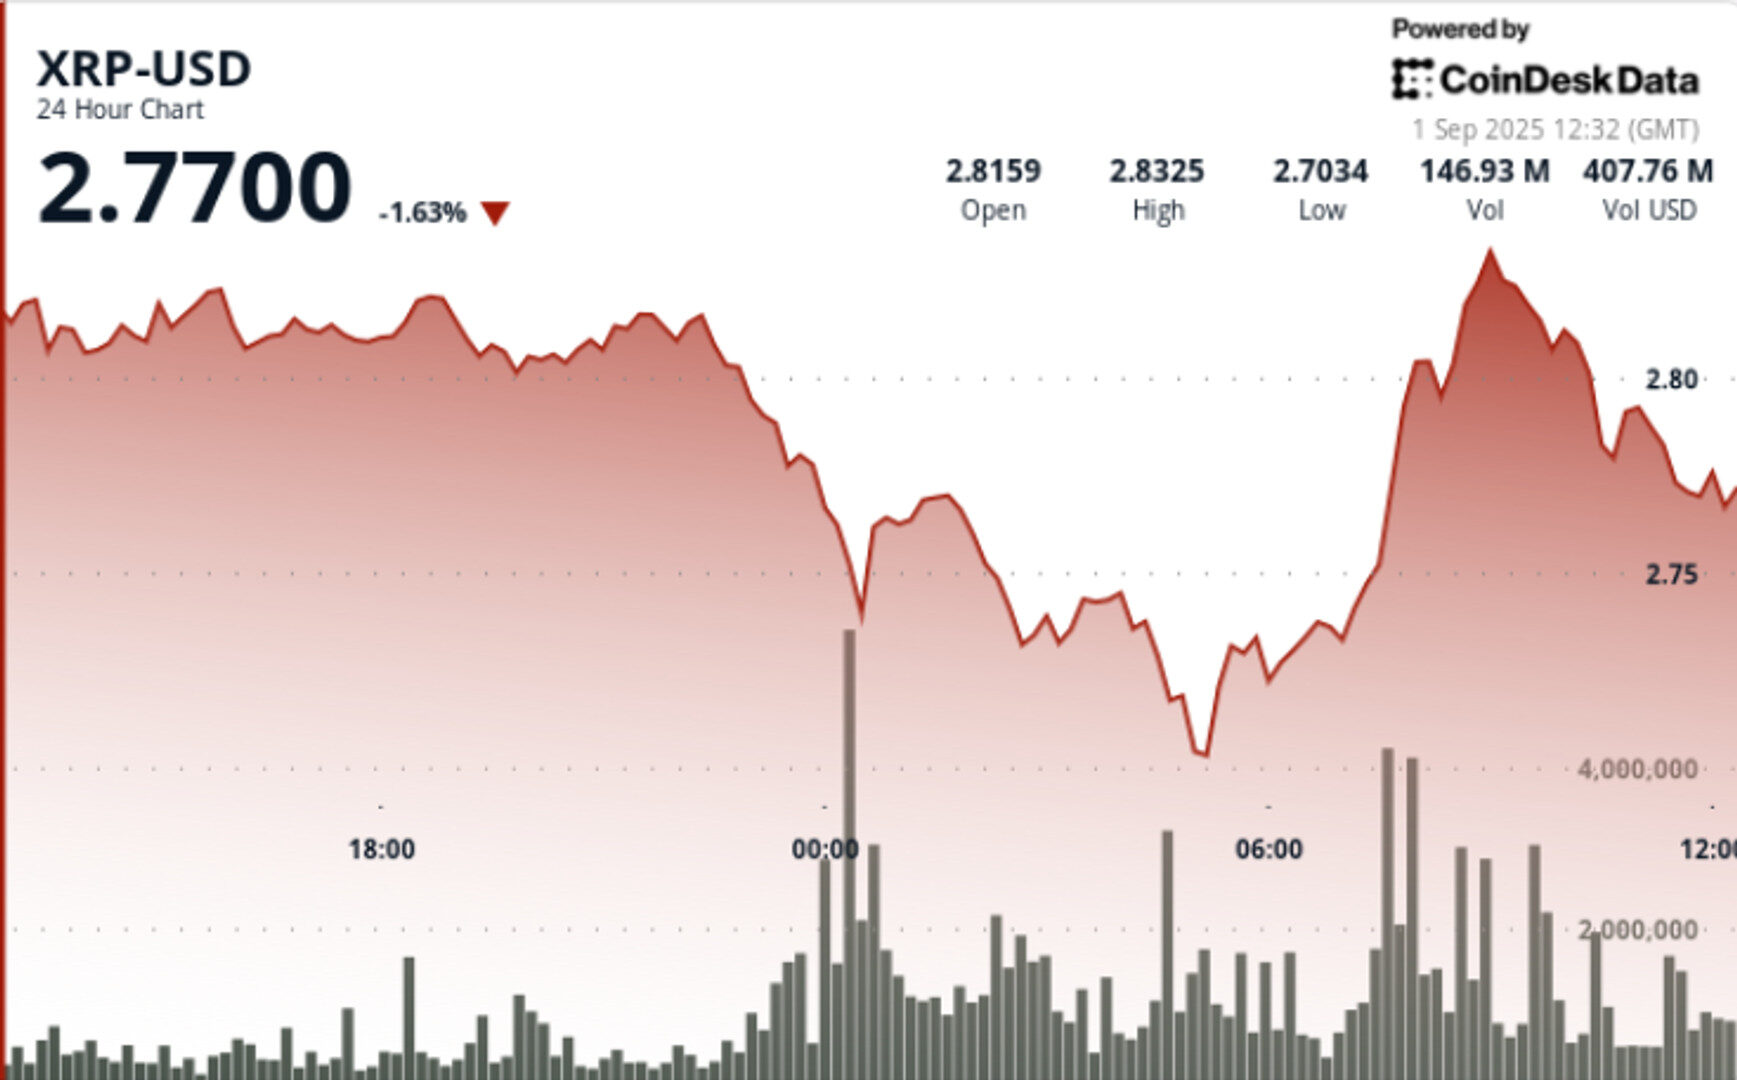
Token trades between $2.70–$2.84 in Aug. 31–Sept. 1 window, with whale accumulation countering heavy resistance at $2.82–$2.84.
By Shaurya Malwa, CD Analytics
Updated Sep 1, 2025, 1:27 p.m. Published Sep 1, 2025, 1:27 p.m.

- XRP traded between $2.70 and $2.84 from Aug. 31 to Sept. 1, with whale accumulation countering resistance.
- Whales accumulated 340 million XRP over two weeks, indicating institutional interest despite bearish trends.
- A breakout above $2.84 could lead to a price range of $3.00 to $3.30, while a drop below $2.70 may expose $2.50 as support.
Token trades between $2.70–$2.84 in Aug. 31–Sept. 1 window, with whale accumulation countering heavy resistance at $2.82–$2.84.
- XRP fell from $2.80 to $2.70 during late Aug. 31–early Sept. 1 before rebounding to $2.82 on heavy volumes.
- Whales accumulated 340M XRP over two weeks, a signal of institutional conviction despite short-term bearish pressure.
- On-chain activity spiked with 164M tokens traded during the Sept. 1 morning rebound, more than double session averages.
- September remains a historically weak month for crypto, but whale accumulation is viewed as a counterbalance to retail liquidation flows.
- Trading range spanned $0.14 (≈4.9%) between $2.70 low and $2.84 high.
- The steepest decline came at 23:00 GMT on Aug. 31, as price slid from $2.80 to $2.77 on 76.87M volume, nearly 3x daily averages.
- At 07:00 GMT Sept. 1, bullish flows drove a rebound from $2.73 to $2.82 on 164M volume, cementing $2.70–$2.73 as near-term support.
- Final hour consolidation (10:20–11:19 GMT) saw price slip 0.71% from $2.81 to $2.79, with heavy selling between 10:31–10:39 on 3.3M volume per minute, confirming resistance at $2.80–$2.81.
- Support: $2.70–$2.73 floor repeatedly defended, reinforced by whale buying.
- Resistance: $2.80–$2.84 remains the rejection zone, with $2.87–$3.02 as the next upside threshold.
- Momentum: RSI near mid-40s after rebound, showing neutral-to-bearish bias.
- MACD: Compression phase continues; potential crossover if accumulation persists.
- Patterns: Symmetrical triangle forming with volatility compression; breakout path remains open toward $3.30 if resistance clears.
- If $2.70–$2.73 holds, short-term traders will treat it as a springboard for $2.84 retests.
- A close above $2.84 would put $3.00–$3.30 back in play.
- Downside scenario: breach of $2.70 exposes $2.50 as next structural support.
- Whale accumulation vs. institutional selling — the push-pull dynamic that could dictate September direction.
More For You
By James Van Straten|Edited by Sheldon Reback
37 minutes ago
The on-chain metric is rising despite bitcoin falling to more than 12% below its all-time high.
What to know:
- Bitcoin’s realized cap, which values tokens only when they move, rose past $1 trillion in July and now sits at a record $1.05 trillion.
- The increase contrasts with a drop in market cap, which revalues all tokens based on the spot price.
- The measure provides an insight into the conviction of bitcoin holders in their investment.


