
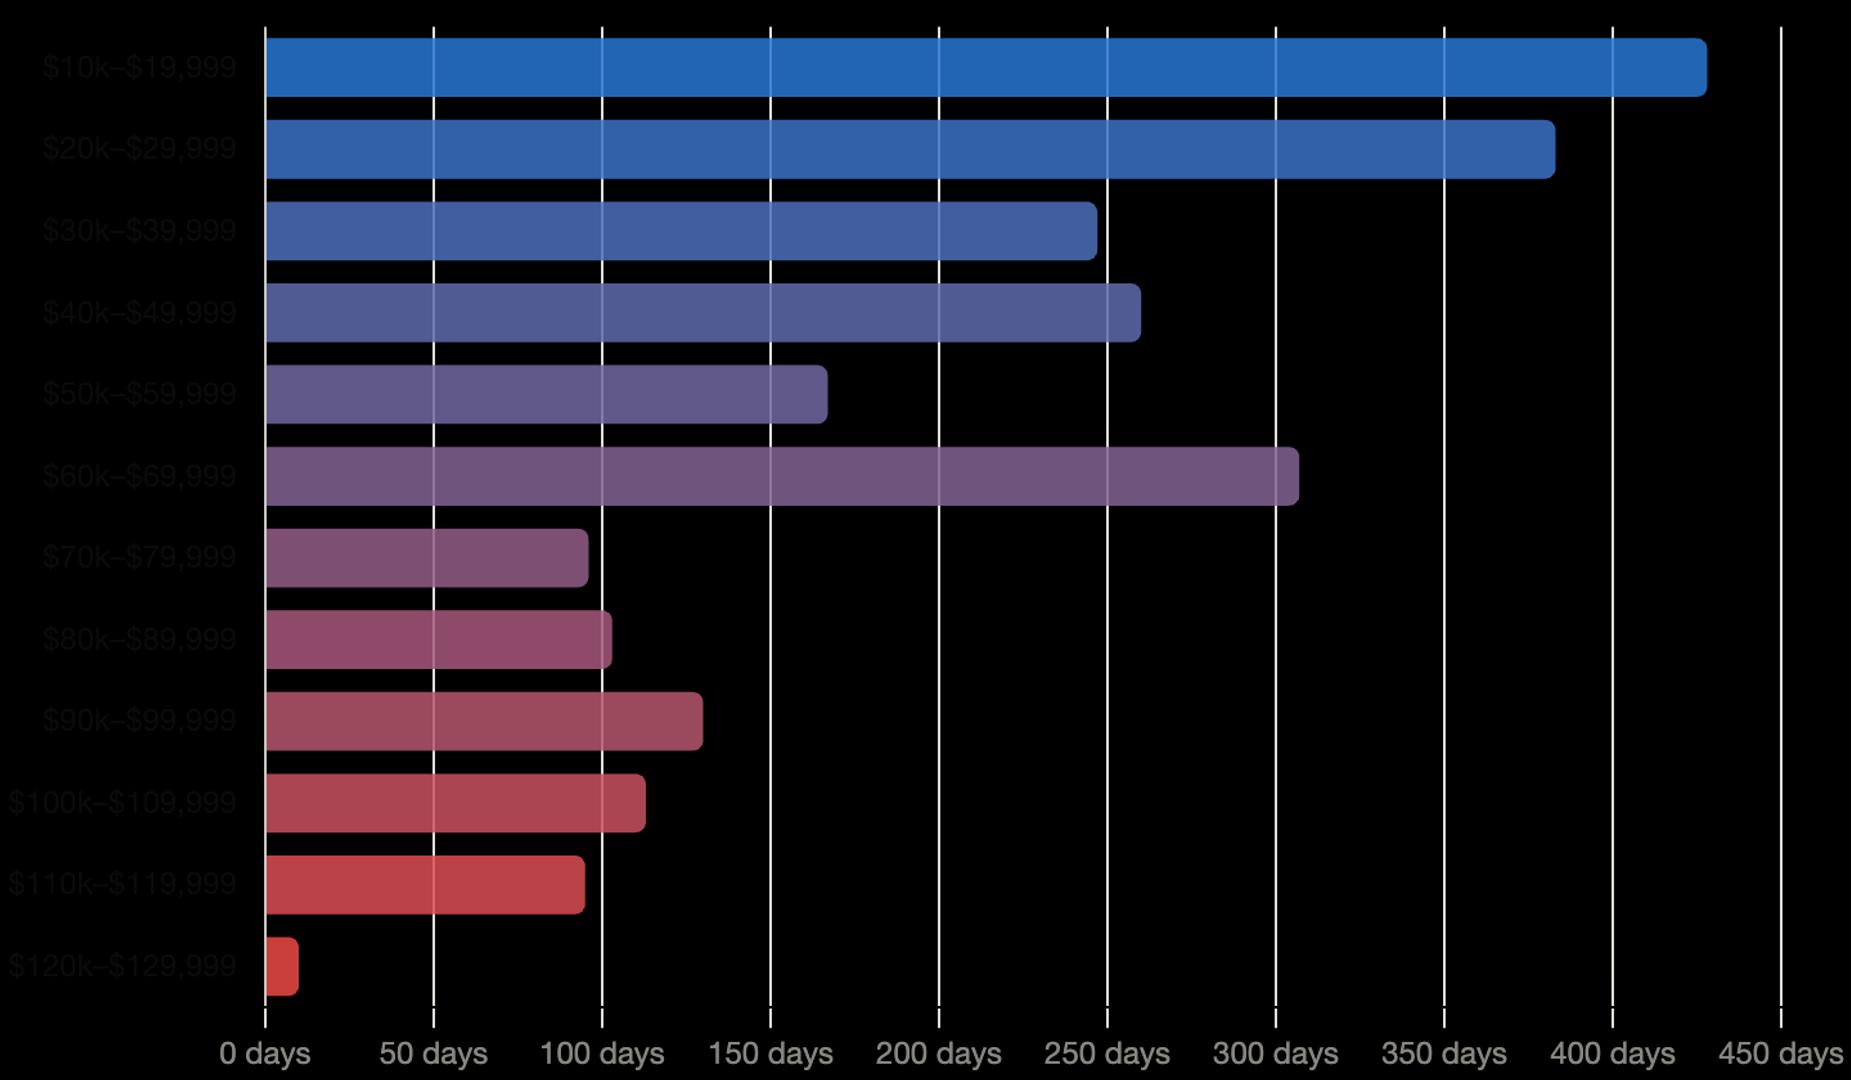
Bitcoin’s $60,000-$70,000 range becomes third most traded range in history
Bitcoin has spent 307 days in the $60,000-$70,000 range, the third longest consolidation in any $10,000 price band.
By James Van Straten|Edited by Jamie Crawley
Updated Jul 10, 2026, 11:18 a.m. Published Jul 10, 2026, 9:16 a.m.
Share this article

Summary
Bitcoin BTC$64,416.61 is trading around $64,000, marking 307 days within the $60,000- $70,000 range.
The consolidation range is now the third longest period spent in any $10,000 price band in bitcoin’s history, behind only the $10,000-$20,000 and $20,000-$30,000, according to Glassnode data.
From a technical perspective, bitcoin continues to trade above its 200-week moving average, currently around $62,873. Historically, prolonged moves below this level have been short lived, making it a closely watched gauge of the long term trend.
Despite holding near $64,000, bitcoin remains roughly 50% below its all-time high reached in October.
Onchain data also points to a significant area of support. Glassnode’s Entity Adjusted UTXO Realized Price Distribution, which tracks the price at which bitcoin last changed hands between economic entities, shows that about 6% of the circulating supply sits between $58,000 and $64,000.

Whether this range ultimately resolves higher or lower remains uncertain, but the prolonged sideways trading has established one of bitcoin’s largest cost-basis clusters to date.
UPDATE (July 10, 11:20 UTC): Amends hed from “Bitcoin’s $60,000-$70,000 range becomes third longest consolidation in history”
Related Assets

- 1
- 2
- 3
- 4
- 5
- 6
- 7
- 8
- 9
- 10


Digital assets posted a third consecutive quarter of losses in Q2 2026, the longest losing streak since the 2022 bear market, as institutional capital rotated into AI equities and Bitcoin ETFs recorded their largest quarterly outflow since launch. Our report examines what drove the divergence, where structural adoption continued regardless, and what Q3 signals to watch.
3 hours ago
Digital assets posted a third consecutive quarter of losses in Q2 2026, the longest losing streak since the 2022 bear market, as institutional capital rotated into AI equities and Bitcoin ETFs recorded their largest quarterly outflow since launch. Our report examines what drove the divergence, where structural adoption continued regardless, and what Q3 signals to watch.
Why it matters:
Digital assets posted a third consecutive quarter of losses in Q2 2026, the longest losing streak since the 2022 bear market, as institutional capital rotated into AI equities and Bitcoin ETFs recorded their largest quarterly outflow since launch. Our report examines what drove the divergence, where structural adoption continued regardless, and what Q3 signals to watch.